


Power BI Sales Dashboard for a Restaurant Chain
Client
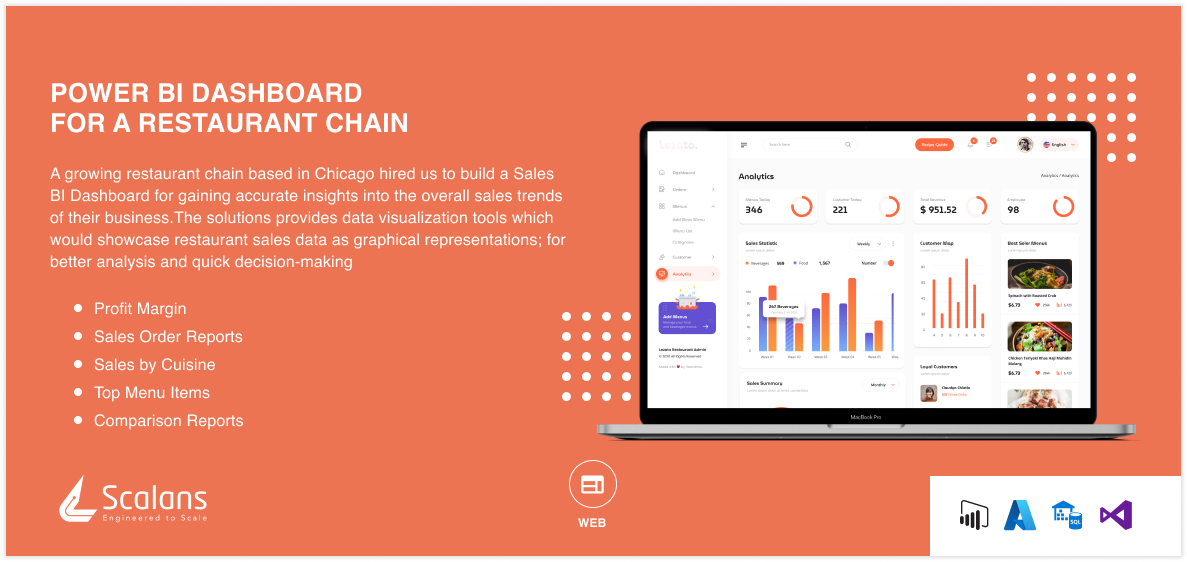
A rapidly expanding restaurant chain based in Chicago hired Scalan Labs to build a Sales BI Dashboard for gaining accurate insights into the overall sales trends of their business. The client wanted a customizable data visualization tool which would showcase restaurant sales data as graphical representations; for better analysis and quick decision-making.
Challenge: The client faced several challenges in managing their sales data effectively:
-
- Data Fragmentation: Sales data was scattered across multiple locations and systems, making it challenging to consolidate and analyze.
- Manual Reporting: Generating reports was a time-consuming, manual process that hindered the ability to make timely decisions.
- Lack of Visibility: The client lacked a centralized platform to monitor sales trends and identify key performance indicators.
Solution
For the project, the Scalans architects zeroed in on Microsoft Power BI – an interactive business intelligence software that helps translate raw data from sources like Excel spreadsheets or .csv files into easily interpretable visual analytics. We designed a simple dashboard for visualizing key sales metrics like top selling food items, profit margin, sales by employees, sales by food category, total sales per hour, day, week and month, etc.
 With the aid of Power BI, the datasets were depicted in the form of visual elements like bar diagrams, treemaps, scatter plots, line graphs and bubble charts. These are interactive; they show changes in patterns when inputs are varied. Here’s a retail sample analysis using Power BI.
Scalan Labs proposed the development of a Sales BI Dashboard to address these challenges effectively. The solution included:
-
- Data Integration: We integrated data sources from various restaurant locations, point-of-sale (POS) systems, and other relevant sources to create a unified data repository.
- Real-time Analytics: Our team implemented real-time analytics capabilities to provide up-to-the-minute insights into sales trends, customer preferences, and revenue streams.
- Customized KPIs: We worked closely with the client to identify and implement key performance indicators (KPIs) tailored to their business goals. This included metrics such as average ticket size, sales per hour, and customer demographics.
- User-friendly Interface: The Sales BI Dashboard was designed with an intuitive user interface, allowing non-technical staff to access and interpret data easily.
- Automation: We automated report generation, reducing the time spent on manual reporting tasks and ensuring that decision-makers had access to the latest data when needed.
Special care has been taken not to clutter the UI; for this, appropriate spacing is given between each element and increased font size (for highlighting metrics like total annual revenue), contrasting colors and color gradients are used for enhancing readability.
Platform: Web
Tools: Custom Visuals, Power BI, Microsoft Azure, SQL Data Warehouse, Visual Studio
Results
After implementing the sales dashboard, the client’s restaurant managers found it very easy to study and deeply understand sales performance; without doing any aggressive calculations, as all the important metrics can be viewed in a single glance on the dashboard.
The implementation of the Sales BI Dashboard had a significant impact on our client’s operations:
-
- Data-Driven Decisions: The restaurant chain could now make data-driven decisions, leading to more effective marketing campaigns, menu adjustments, and staff allocation.
- Increased Efficiency: Automation of reporting processes freed up valuable employee time and reduced errors associated with manual data entry.
- Enhanced Customer Experience: The client could tailor their offerings based on customer preferences and trends, resulting in improved customer satisfaction and increased sales.
- Improved Profitability: By closely monitoring sales data, the client identified opportunities to optimize pricing strategies, resulting in higher profit margins.
- Expansion Planning: Armed with accurate insights, the restaurant chain confidently pursued expansion plans, opening new locations strategically based on data-driven market analysis.
Grey areas that needed improvement could be identified and sales could be forecasted according to the available trends. All in all, with the help of the tool, the client could draw strong inferences and make better-informed decisions for boosting business growth.
“Innovation distinguishes between a leader and a follower.”
-Steve Jobs, Former CEO, Apple.
More Case Studies


Want to Develop a BI-powered Dashboard?
Get in touch with our team to find out more about how we can develop your software development needs.